Search Focus Are A SEO Company That Can Increase Your Online Sales Revenue Through Driving Qualified Targeted Visitors To Your Website
Understanding GA4 Reporting and Data Visualisation: A Complete Guide
GA4 Reporting That Shows What Is Really Happening
GA4 reporting can look simple at first. Open a report. Pick a date range. Read the numbers.
Then the questions start. Why are sessions different from users? Why has a key event disappeared? Why does traffic from one channel look healthy while enquiries are flat? And why does one dashboard tell a slightly different story from another?
For a freelancer, small business owner or marketing manager, GA4 only becomes useful when it helps with decisions. I don’t want reports that look impressive but say very little. I want reports that show where visitors come from, what they do, what slows them down, and whether the website is producing calls, forms, bookings, purchases or other valuable actions.
Over the past 24 years, working across SEO, website development and online marketing for UK businesses, I have seen one pattern many times: weak reporting usually leads to weak decisions. The website might be getting traffic, but nobody is clear which pages create enquiries. Or the business tracks rankings but misses the form errors, broken journeys and confusing calls to action that stop leads from arriving.
GA4 can help fix that. But only when it is planned properly.
Why GA4 Reporting Feels Different From Older Analytics
GA4 uses an event-based model. That is the biggest change to understand.
Older Universal Analytics reporting was built around sessions, pageviews and a more rigid structure. GA4 still reports on sessions and page views, but the underlying measurement is based on events. A page view is an event. A scroll can be an event. A file download, video view, form submission, phone click or purchase can also be an event.
This makes GA4 more flexible, but it also means messy tracking can quickly create messy reports. If the events are not named clearly, marked correctly or tested properly, the reports become harder to trust.
For a fuller grounding in how the platform works, my Google Analytics 4 practical guide covers the wider setup, privacy checks and SEO use cases. Reporting sits on top of that foundation.
The main mindset shift: GA4 is not just a visitor counter. It is a behaviour measurement system.
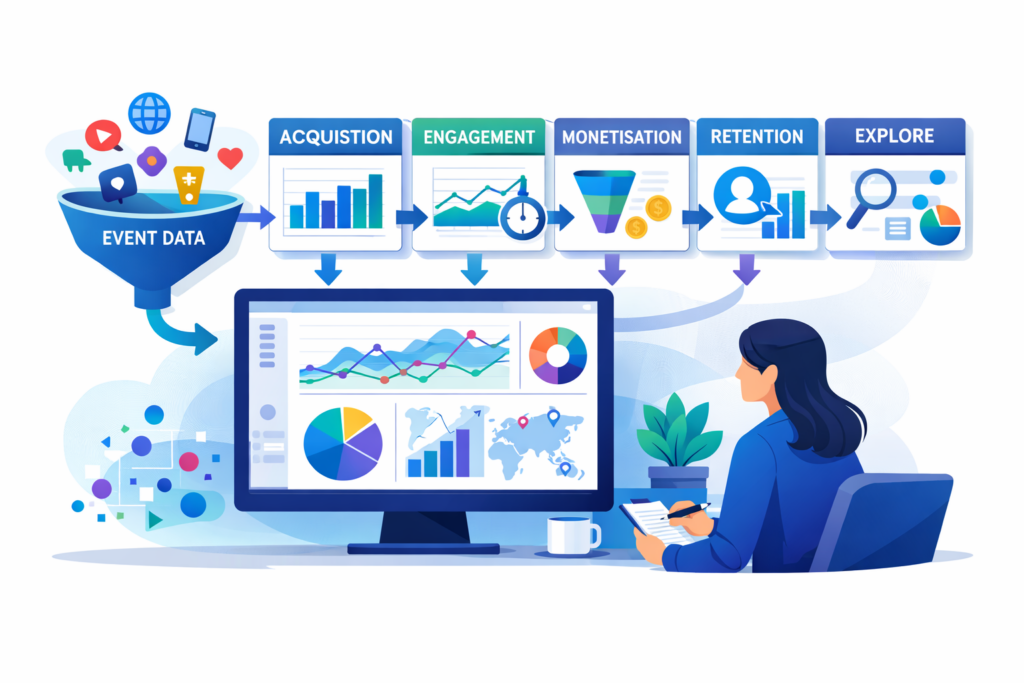
| Reporting area | What it helps you understand | Typical business question |
|---|---|---|
| Acquisition | Where users and sessions come from | Which channels bring useful visitors? |
| Engagement | How people interact with pages and events | Are visitors actually using the site? |
| Monetisation | Revenue, purchases and ecommerce behaviour | Which products and journeys make money? |
| Retention | How users come back over time | Do people return after the first visit? |
| Explore | Custom analysis using segments and dimensions | What is happening beneath the headline numbers? |
The Reports That Matter Most
GA4 has standard reports for quick checks and Exploration reports for deeper analysis. Both are useful. Neither should be treated as a complete answer on its own.
Reports snapshot. This is the quick overview. It gives a broad view of users, events, conversions or key events, traffic sources and recent trends. I use it as a starting screen, not as the final report.
Realtime. Realtime reporting shows activity from the last 30 minutes. It is useful for testing tracking changes, checking whether a form click is being recorded, or confirming that a newly published page is receiving visits. It is not ideal for judging campaign performance because the window is too short.
Acquisition reports. These help separate traffic by source, medium, campaign and channel grouping. For SEO work, the organic search view matters, but I also look at referral, paid search, email and direct traffic because customer journeys rarely stay in one neat channel.
Engagement reports. Engagement reports show events, pages, screens and user behaviour. This is where poor content, weak internal linking or confusing navigation often shows up. A page may attract visits but produce very little engagement.
Monetisation reports. These are important for ecommerce websites and any setup where revenue is tracked. The quality of ecommerce reporting depends heavily on correct event implementation, product data and transaction tracking. If the setup is wrong, the revenue reports will not rescue it.
Explore reports. Explorations are where GA4 becomes much more useful. You can build free-form tables, funnel explorations, path explorations, cohort reports and segment comparisons. They are excellent for questions such as: which landing pages bring engaged users from organic search, which device types struggle to convert, and where people drop out before completing an enquiry?
Before Building Dashboards, Decide What Success Means
A dashboard without a business goal is decoration.
The first job is to decide what needs to be measured. A local service business may care most about phone calls, contact forms and quote requests. An ecommerce store will care about product views, add-to-basket events, checkout steps, purchases and revenue. A publisher may focus on engaged sessions, scroll depth, returning users and newsletter sign-ups.
When working on SEO campaigns for UK businesses, I usually separate metrics into three groups.
- Visibility metrics: organic traffic, landing page sessions, search queries from Search Console, impressions and click-through rate.
- Behaviour metrics: engagement rate, events per session, page paths, scrolls, internal search and device category.
- Commercial metrics: calls, forms, purchases, bookings, downloads, quote requests and other key events.
The commercial layer matters most. Rankings and visits are useful, but they do not pay the bills unless they help create enquiries, sales or another meaningful outcome.
For event planning, the detail matters. My GA4 event tracking walkthrough goes deeper into event types, naming, testing and key events. Reporting becomes much easier when those foundations are clean.
Preparation Guide: What To Check Before Reporting
Good reporting starts before the first chart is built. Rushing this stage is one of the easiest ways to create dashboards that nobody trusts.
What to check first.
- Confirm the correct GA4 property is installed on the website.
- Check whether Google Tag Manager is being used, and whether tags are firing once rather than twice.
- Review enhanced measurement settings such as scrolls, outbound clicks, site search, file downloads and video engagement.
- Check that important actions are tracked as events.
- Mark genuinely valuable actions as key events.
- Make sure internal traffic and developer traffic are handled correctly where practical.
- Review consent settings, cookie notices and privacy wording.
- Check whether ecommerce tracking is correctly implemented, if relevant.
Safety considerations. Analytics reporting is not just a marketing task. It involves data handling. Avoid sending personal information such as names, email addresses or phone numbers into GA4 event parameters. Be careful with form fields, page URLs and search terms because these can accidentally include personal data. From a practical UK business perspective, consent, cookie settings and data processing responsibilities should be reviewed properly. I also recommend checking your internal handling of analytics access against a clear website data security policy.
Tools and materials.
- GA4 access with suitable permissions.
- Google Tag Manager access, if tags are managed there.
- A list of business goals and enquiry types.
- A spreadsheet for mapping events, dimensions and dashboard sections.
- Access to the website CMS, such as WordPress.
- Test forms, test basket journeys or test booking flows.
- A dashboard tool, if native GA4 reports are not enough.
Preparation steps. Start by listing the website actions that matter. Then map each action to an event name. Decide which events should become key events. Test them in GA4 Realtime or DebugView. Only then build reports. It sounds slow, but it saves time later — especially when someone asks why the numbers changed last month.
Main Instructions: Building A Useful GA4 Reporting Setup
Step 1: define the audience. A business owner does not need the same report as a technical marketer. A monthly management report should show outcomes, trends and decisions. A working SEO report can include more detail, such as landing page performance, query movement, internal link opportunities and technical issues.
Step 2: choose the date ranges. Look at the last 28 days, the previous period, and the same period last year where the data is reliable. Seasonality can distort short-term comparisons. For local businesses, bank holidays, weather, school holidays and industry demand can all affect behaviour.
Step 3: build around questions. Strong reports answer questions. Which channel brought the most engaged visitors? Which landing pages created enquiries? Which device type had the weakest conversion rate? Which campaign produced traffic but no action?
Step 4: separate traffic quality from traffic volume. More visits are not always better. If traffic grows but key events fall, something may be wrong with targeting, page relevance, tracking, usability or offer strength.
Step 5: annotate changes. GA4 reports make more sense when website changes are recorded. Note content updates, site migrations, new forms, tracking changes, campaign launches and technical fixes. Without notes, people guess. Guessing wastes time.
Data Visualisation: Making Reports Easier To Read
Data visualisation is not about making charts pretty. It is about reducing the effort needed to understand what is happening.
I prefer simple dashboards that group information by decision type. A good report should allow someone to see the current position, spot movement, identify a possible cause and choose the next action.
| Chart type | Best used for | Avoid when |
|---|---|---|
| Scorecard | Key totals such as users, enquiries or revenue | The number needs heavy explanation |
| Line chart | Trends over time | The date range is too short to show a pattern |
| Bar chart | Comparing channels, pages or devices | There are too many categories |
| Table | Detailed page, query or event analysis | The audience needs a quick executive view |
| Funnel | Checkout, booking or enquiry journeys | The steps are not tracked consistently |
Use colour sparingly. Red should mean a real warning, not just a lower number. Green should mean progress against a meaningful target, not vanity growth.
A dashboard also needs labels that humans understand. Nobody outside the reporting setup wants to decode event names such as generate_lead_v2_form_submit_footer. Use clear chart titles and plain-language sections.
Native GA4 Reports, Explorations And External Dashboards
There are three common ways to work with GA4 reporting: native reports, Explorations and dashboard tools.
Native GA4 reports are useful for routine checks. They are quick, already inside GA4, and good enough for many smaller websites. The limitation is that they can become awkward when you need a polished management report or a combined view of GA4, Search Console, ads and sales data.
Explorations are better for investigation. If I want to compare organic users by landing page, device and key event behaviour, Explore gives me more control. The downside is that Explorations can feel less friendly for non-technical users.
External dashboards are useful when the report needs to be shared regularly, branded, filtered or combined with other data sources. The danger is dashboard bloat. Too many charts can hide the answer rather than reveal it.
Reports I Normally Recommend For SEO And Lead Generation
For SEO and lead-generation websites, I would normally start with a small number of focused reports.
Organic landing page report. This shows which pages attract visitors from organic search and what those visitors do next. It is especially useful for service pages, location pages and blog content. A common issue I see on business websites is that informational blog traffic grows while service enquiries stay flat. That is not always bad, but it needs to be understood.
Key event report. This should show forms, calls, quote requests, bookings, downloads or purchases. If a website has multiple enquiry types, separate them. A phone click is not the same as a completed form. A newsletter sign-up is not the same as a quote request.
Device performance report. Mobile traffic often dominates, but mobile conversion rates can suffer when forms are awkward, buttons are too close together or page speed is poor. If mobile engagement is strong but enquiries are weak, test the journey by hand.
Channel quality report. Compare organic search, paid search, referral, direct, email and social traffic. Do not judge channels only by sessions. Look at engagement, key events and revenue where available.
Content performance report. This helps decide whether content should be improved, merged, internally linked, expanded or removed. From reviewing and improving websites over many years, I have found that lots of thin pages can make reporting noisy and SEO strategy harder to manage.
Where AI tools or automation are used in marketing, reporting needs to be even tighter. The relationship between automation and measurement is covered in real-time analytics for AI, especially where fast feedback can prevent poor decisions spreading across campaigns.
Common GA4 Reporting Problems And How To Fix Them
Problem: traffic suddenly drops. The issue may be real, but it may also be tracking-related. Common causes include a missing tag, a changed consent banner, a website update, a broken Google Tag Manager container, a migration error or a filter excluding too much traffic.
Fastest solution: check Realtime, test the website in an incognito window, review Tag Manager preview mode if used, and compare GA4 with server logs, Search Console or ad platform data where available.
How to fix it: restore the missing tag, correct the consent configuration, republish the correct container, or update the tracking code across the affected templates. In WordPress, check whether a theme update, plugin conflict or page builder change removed header scripts.
Signs of a more serious problem: all channels drop to near zero, ecommerce revenue disappears, events stop firing across every page, or the issue begins exactly when a new cookie tool, theme or site migration went live.

Prevention: record tracking changes, test after website updates, keep a simple event map, and check Realtime after major publishing work.
Problem: key events are inflated. This often happens when the same event fires more than once. Form submissions may trigger on button clicks and successful submissions. Thank-you pages may refresh. Phone clicks may be counted repeatedly by the same user.
Fastest solution: test the action yourself and watch the event count in DebugView or Realtime.
How to fix it: adjust the trigger so it fires only on successful completion. For forms, this may mean using a thank-you page, a confirmed form submission event, or a more reliable data layer event rather than a simple button click.
Signs of a more serious problem: key events exceed realistic enquiry levels, conversion rates look unusually high, or events appear on pages where the action cannot actually happen.
Prevention: document every key event, test after plugin updates, and avoid setting broad click events as business-critical conversions without validation.
Problem: reports disagree with other platforms. GA4, Google Ads, Search Console, ecommerce platforms and CRM systems use different attribution rules, time zones, processing methods and definitions. Matching them perfectly is often unrealistic.
Fastest solution: check whether the same date range, attribution model, currency, time zone and event definition are being used.
How to fix it: decide which platform is the source of truth for each question. GA4 may be best for website behaviour, Search Console for organic search visibility, the ecommerce platform for completed revenue, and the CRM for qualified leads.
Signs of a more serious problem: one system shows zero sales while another shows normal orders, or source data is missing from a large proportion of transactions.
Prevention: agree reporting definitions before presenting results. Simple, written definitions stop arguments later.
Custom Dimensions, Segments And Audiences
Standard reports answer common questions. Custom dimensions and segments answer better ones.
A custom dimension might capture a form type, content category, logged-in status, appointment type or lead source detail. Used carefully, these can make reports much more useful. Used carelessly, they create clutter and confusion.
Segments are powerful because they isolate behaviour. You might compare organic visitors with paid visitors, mobile users with desktop users, or first-time users with returning users. This is where hidden performance issues often appear.
Audiences can also be used for analysis and advertising activation, depending on the setup. Be careful here. Audience creation should match the business goal and the consent position. Do not create audiences just because the option exists.
How To Present GA4 Reports To Non-Technical People
The best report is not the one with the most metrics. It is the one that leads to the clearest decision.
When I prepare reporting for a business audience, I try to keep the structure simple: what changed, why it may have changed, what it means commercially, and what should happen next. If a metric does not support one of those points, it probably does not need to be on the first screen.
Use notes. A short written observation beside a chart can save ten minutes of confusion. For example: “Organic enquiries fell while organic traffic rose, mainly because the traffic increase came from two informational blog posts rather than service pages.” That is much more useful than a naked traffic graph.
Training also helps. Anyone who regularly uses GA4 should understand the language of events, users, sessions, engagement and key events. If certification is useful for your role, my GA4 certification preparation guide gives a practical route through the learning process without treating the certificate as a substitute for hands-on testing.
A Simple Monthly GA4 Reporting Rhythm
Monthly reporting works best when it follows a repeatable pattern.
- Week start check: confirm tracking is working and key events are still recording.
- Monthly review: compare traffic, engagement and key events with the previous period and the same period last year where useful.
- Page review: identify landing pages gaining or losing organic traffic.
- Journey review: test the main enquiry, checkout or booking routes manually.
- Action list: agree content, technical, UX or tracking changes.
- Annotation: record major changes so future reports make sense.
This rhythm keeps reporting close to action. It also prevents the common problem where analytics is only opened after something has already gone wrong.
What Good GA4 Reporting Should Achieve
Good GA4 reporting should make a website easier to improve. Not noisier. Not more confusing. Easier.
It should show which channels attract useful visitors, which pages support enquiries or sales, which journeys create friction, and which actions deserve attention next. It should also make uncertainty visible. Sometimes the correct answer is “we need cleaner tracking before making that decision”. That is better than pretending poor data is reliable.
For freelancers and small businesses, the strongest setup is usually practical rather than elaborate: clear events, sensible key events, a small set of reports, honest commentary and regular checks. Add complexity only when it improves decisions.
GA4 is not perfect. No analytics platform is. Consent settings, attribution differences, blocked scripts and user behaviour all affect the numbers. The aim is not to create a flawless mirror of reality. The aim is to build a reporting system that is accurate enough, consistent enough and clear enough to support better marketing decisions.
That is where GA4 becomes valuable: not as a wall of charts, but as a working tool for improving visibility, usability, enquiries and sales over time.